I do not like mess.

One of our DITA session was about Archiving Twitter with a Google Spreadsheet. To do such a thing we have to go to Hawksey Tags in the first place.

twit 0

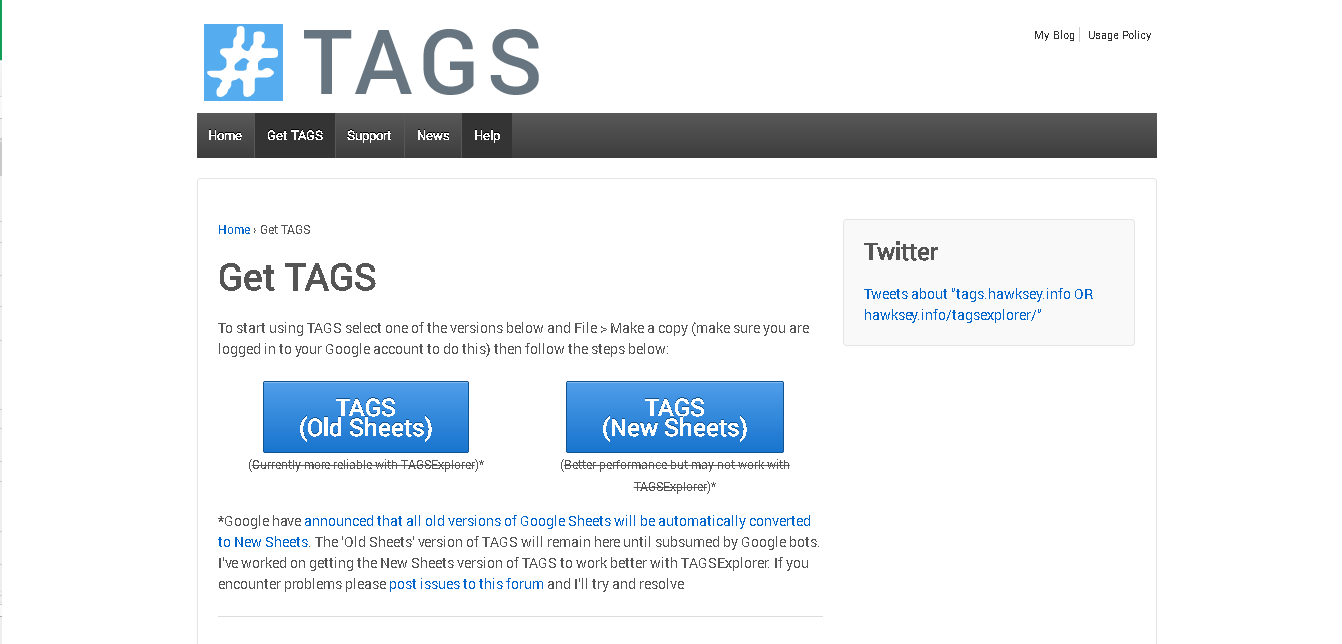
http://tags.hawksey.info/get-tags/ Accessed 8/12/2014

 In the handout guidelines it was said to use Old Sheets TAGS but after taking a screenshot (and experiencing some error) I decided to go crazy and use New Sheets TAGS. To my surprise there was not much difference between them. Pictures below reveal that there is almost almost no difference in New and Old Sheets.

twit 1twit 2


To create Twitter Archive I copied a spreadsheet given by google and used same parameters as advised by Ernesto.

twit 3 archiv summarytwit 3 changes

twit 3 dashboardtwit 3
https://docs.google.com/spreadsheet/ccc?key=0AuxqxcATBAe3dFJWSEJkbDU2Um5WY1JaZkRjWnpnelE#gid=121 Accessed 8/12/2014

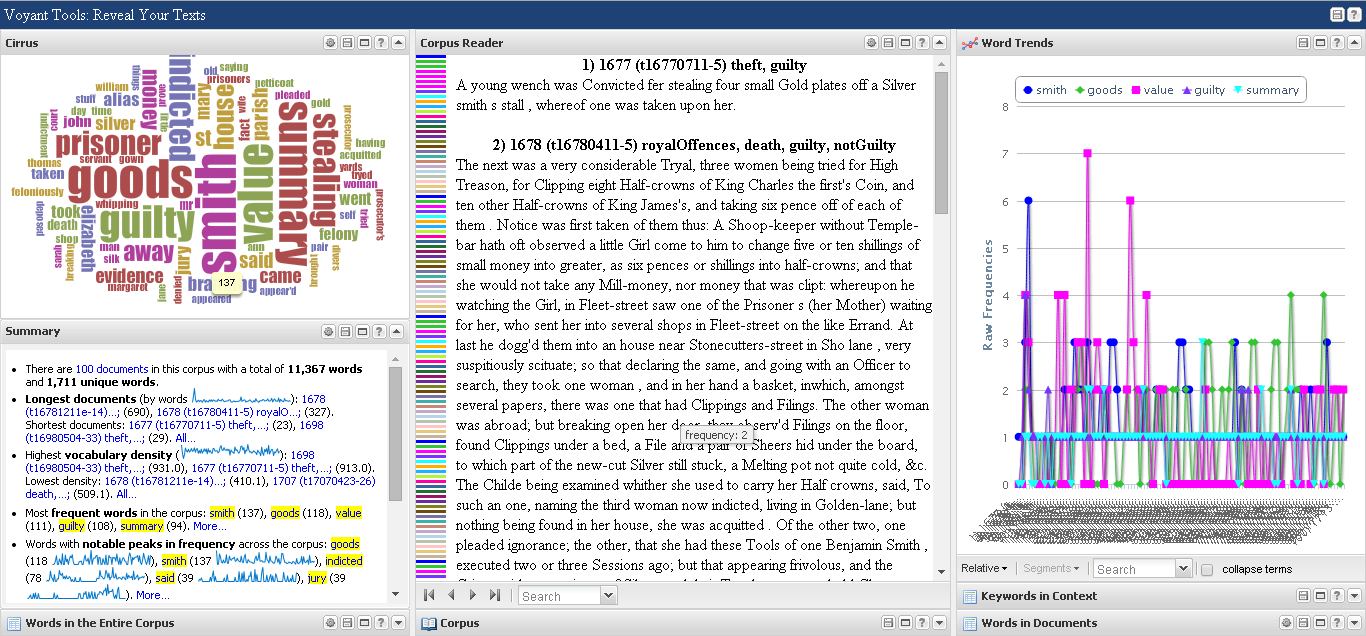
It takes a while to connect everything properly – signing into google, authorising the app,giving it a permission to run and connecting to Consumer Key and Consumer Secret, creating a new folder in google drive. After all of this is done, google spreadsheet works instantly using Twitter’s API and provided data. TAGS process data into diagrams or tables depending on indication. Variable possibilities of metrics are accessible at different spreadsheet tabs: Readme/Settings, Archive, Summary, Dashboard. When opening spreadsheet there are only two spreadsheets – Readme/Settings which is the main page and Archive, which is the second sheet. Other sheets like Summary and Dashboard can be easily created in TAGS with one click only which is very handy and neat. I like when things are in order and having different metrics contained in different sheets makes my heart feel happy. Exporting data into a spreadsheet is always a good idea because as there is a countless number of sorting that can be performed on data using them.

It is very interesting how easily Twitter data can be exported and measured. Exploring and archiving Tweets is very easy and can bring many benefits. I do not like mess and overload. Unfortunately social media overload us with information that is not necessarily needed.   I like when data I need is neatly sorted and easily searchable. I find spreadsheets the best way to keep data in order and would recommend it to everyone. Great thing I have not mentioned so far is that, not only your own Tweets but others as well. Hints on Twitter accounts that should be archived by librarian for their own professional use and development can be find here:
http://hacklibraryschool.com/2014/05/27/hashtags/

Try to explore it yourself and have fun!


Twitter Metrics

Today was the last DITA session. We are now almost half way through lectures. Our last had to be spent well. As most of the time we talk about Twitter and it’s benefits, this time we explored a bit of everything according to Twitter usage. A bit of app exploring, some excel spreadsheets, small bit of customising.

So there was Twitter Analytics to start with.

metrics 1

https://analytics.twitter.com/user/JoannaBabicz89/tweets Accessed 8/12/2014

As I signed up for Twitter Analytics only recently, I can view analysis of my tweets of from period of time from 23 Nov 2014 – 8 Dec 2014. On this page I was told I have posted four tweets over mentioned period and earned 153 impressions over 16 days what (according to Twitter Analytics) gives an average of 10 per day. My engagement rate is very poor, not surprisingly, as I am not very active on Twitter. Unfortunately full time work has it’s drawbacks.

Going further I exported my Twitter Analytics data into an excel file, as advised and changed layout a small bit.

metrics 1 nov dashboard

I definitely had to change font as Times New Roman is the easiest to read for me. Then I personalised it a bit by putting in my own data into fields.

metrics 1 nov EXCEL

As it can be seen in the picture I do not post much and as I have only 47 followers I do not receive many replies.

Another thing we were supposed to do during the last session was to explore Datawrapper and RAW  so I created some diagrams visualisations of my Twitter Metrics.

raw 1 raw 2

Raw.densitydesign.org Accessed 8/12/2014

RAW is an easily accessible tool that gives a few possibilities of different charts and is free.

Another tool is Data Wrapper.

data wrapper 1data wrapper 2

https://datawrapper.de/chart/KekVP/publish Accessed 8/12/2014.

It is a bit more hassle to use Data Wrapper. But it seems to be worth it. It is a bit more advanced, gives many more possibilities of data visualization (i.e. map) and export to PDF capabilities.

All of the above are great for working with data, metrics or statistics as they give instant diagrams/graphics and I am definitely use them in future.

Altmetrics – new possibilities.

At one of our DITA lectures we learnt about Altmetrics. Altmetrics are essentially alternative metrics of measuring scholarly impact. Measuring has been based previously based on number of times an article or paper is cited in other articles but since Information Era traditional method had to become accessible faster and easier. As a response to that demand a group of scientists-researchers created Altmetric App which won Elsevier’s App for Science competition prize and won. Mission of project is: ‘to track and analyse the online activity around scholarly literature’ [http://www.altmetric.com/about.php, accessed 3/12/2014].

What does Altmetrics do? Altmetric website offers a range of products:
– Altmetric Explorer which is a web application that helps to see all of the attention surrounding papers
– Altmetric Bookmarklet is a free browser tool that lets instantly get article level metrics for any recent paper
– Altmetric API an application programming interface that enables to enrich pages with article level metrics data
– Altmetric Badges are ready-to-use embeddable badges for article pages that let you showcase impact in a beautiful way

OB 1
Altmetric.com/whatwedo Accessed 3/12/2014.

Altmetrics created a great tool to cluster digital mentions of articles at social media sites, newspapers, government policy documents. Citation score is based on three factors which are: volume, sources and authors. A very important note here is that, the system works live and all articles published before it was launched in July 2011 do not have any transient links (ie. tweets) counted in the score.

After logging in you can ‘Explore the data’ what means we can precisely search for articles to look up their altmetrics score which is visualised by so called ‘Donuts’.

OB 1
Altmetric.com/explorer 3/12/2014

We can also save a search for future, explore it into excel and process it further or set up daily or weekly notifications regarding the search. Below are my saved searches.

OB 1
Altmetric.com 3/12/2014

I find Altmetric.com to be a great tool for nowadays research. In times of digitised science it is just another great step ahead of LIS  services accessible 24/7. Altmetrics team is also involved into a number of projects about Altmetrics itself and it’s influence on modern research.

References:

Priego, E. (2014) Digging into Altmetrics Data [Lecture] INM348 DITA week 6. Given at City University of London on 10/11/2014.

Priego, E. (2013) Strategies to get your research mentioned online, [http://figshare.com/articles/Strategies_to_Get_Your_Research_Mentioned_Online/106950] Accessed 3/12/2014.

Digital Humanities Project – Data Mining

Digital Humanities Project Asymmetrical Encounters.

Data Mining is one of new researching technologies used by Translantis – Digital Humanities ‘Asymmetrical Encounters: E-Humanity Approaches to Reference Cultures in Europe, 1815-1992 project.

First of all, let’s talk a bit about what data mining is.

http://www.youtube.com/watch?v=VPtvFO0dfAQ

Following lovely students from video on above, Data Mining is:
– a process of analyzing data from various perspectives in order to summarize it for useful information
– discover intelligence in data warehouses blinded to reports and queries
– intelligence acquired from patterns and and relationships found in data
Internal factors: price, positioning in store, staff skills.
External factors: economic indicators, competition, demographic indicators.

Making long things short, Data Mining is about finding information that can not be revealed by other research methods, and finding out even more than before.

On the 24th of November 2014 Ulrich Tiedau gave a lecture on the Digital Humanities Asymmetrical Encounters. The research project aims to help understanding influence of France, Germany and England on the Netherlands, Belgium and Luxemburg as knowledge-based economies. Five scientists of different nationalities take part in the project. It has received a grant of one million euros of HERA – Humanities in the European Research Area. Basing or digitised newspapers from the British Library, the National Library of the Netherlands, the Bibliotheque Nationale de Luxembourg as well as other European libraries, implementing multilingual and trans-national text mining using OCR they search for trends in society between 1815 to 1992.

OB 2

Asymmetrical Encounters research project website. Accessed 1/12/2014.


Scientists use distant reading as well as close reading. They search for topic, check it’s popularity across years in resources, compare it with other topics, check where was the topic appearing the most often and search for explanation of patterns. Deep analysis help in better understanding of life of our european ancestors. I find AsymEnc research very interested. So was lecture about it given by Ulrich. I am very grateful I could learn a bit from a data mining professional, as from now on I can see lots of new possibilities for my future career development.


Reference

Tiedau, U. (2014) Assymetrical Encounters [Lecture] INM348 DITA week o7. Given at City University of London on 24/11/2014.

Old Bailey Online

Old Bailey Online is a great project that makes 197,745 criminal trials held at London’s central criminal court searchable. Great idea as every user can have now online insight into english criminal affairs from 29th April 1674 till 1st April 1913 . I find it fascinating myself as circa 50% of my family worked or is still working for the Police. I wanted to join force myself and be a Detective once but that’s a different story.

Here is a screen of a main page:

http://www.oldbaileyonline.org/

OB 1
Old Bailey Online project website. Accessed 1/12/2014.

It should not be confused with:

http://oldbaileyonline.org.uk/

which looks a bit like a Beta – version of the proper website

OB 1
Old Bailey Online website. Accessed 1/12/2014.

The http://www.oldbaileyonline.org/obapi/ gives 2 possibilities of search Keyword search and API Search.

Lets start with Keyword search.

Website provides a tutorial on how to use search tools.

OB SEARCH
Old Bailey Online website search engine. Accessed 1/12/2014.

As we can see in the picture above there is a few different search fields:
– Keywords
– surname
– given name
– alias
– offence
– verdict
– punishment
– search in
– time period
– reference number

There is also a great explanation of how to perform advanced search (picture below)

OB SEARCH ADV

I performed search on ‘Horgan’ and I found a bunch of people involved in burglaries, robberies and witnesses in for both types of cases.

Let’s try API search now.

API search was funded as a part of Digging Into Data project. Tree online resources are in the Datamining with Criminal Intent project. Old Bailey Online, Zotero and Voyant Tools together allow users all over the world to study the 127 million words of trial text using Voyant Tools which is an analytical tool and Zotero which is a management tool.

Let’s see what happens if I search for: ‘guilty’, ‘Smith’, ‘female’.

Apparently there was lots of guilty ladies named Smith between 1674 and 1913. I got 3550 records returned.

OB 1
Old Bailey Online API search website. Accessed 1/12/2014.

I am going to export it to Voyant Tools now.

OB 1

Voyant Tools website. Accessed 1/12/2014.

OB 1
Voyant Tools website. Accessed 1/12/2014.

OB 1
Voyant Tools website. Accessed 1/12/2014.

Fascinating how we can see which words were the most common used over years. It can indicate many things like i.e what was the most important in the cases? Guilt? Goods? Value? Or maybe it was only up to writers style? That is exactly where Data Mining starts it’s magic.

Distant reading.

Discovering new researching methods is always interesting. Especially if it is much simpler than it seemed. I guess most of us have seen images of words sets sorted by relevance of importance but not all of us know how easy it is to produce such a lovely picture. Lovely for people who are in love with words of course. Currently there are a few tools to produce such a thing:

Wordle.

http://www.wordle.net/

Very simple to use, plain and easy readable layout and, what I am personally very happy about, has huge range od common words lists in many languages.

Screw 2

Voyant-Tools

http://voyant-tools.org/

Again, esy to use, almost guides you to explore advanced settings where you can produce graphs out of whole taxt as well as of choosen pieces only.

Screw 1 Screw 3 Screw 4

Many Eyes

many-eyes.com

Didn’t get a chance to explore this one, as my lovely university email cracked today and I could not set up account (it is not needed with previous tools). Still think it seems pretty easy to use out of what I can see at other students desktops;)

Textal

textal.org

Created by  Centre for Digital Humanities, friendly looking free app that can be used on most of smartphones. Allows you to create search instantly on you phone based on web resources or books (ebooks stored on you phone I guess). Unfortunately my phone cracked while trying to search ‘feminism’ at guardian.co.uk, and ‘an error occured’ while trying to perform search based on my books.

Wish to enclose screen shots for last two but impossible as could not use it myself. Try to enjoy it yourself!

Just to show you great ideas/ possibilities of this type of programmes I will present very interesting application twitted just a few minutes ago by my friend (also professional librarian) @MagdaSzuflita

http://blog.oxforddictionaries.com/2013/12/oed-birthday-words/

The app lookups you year of birth and returns words originated in year of your birth. Isn’t it amazing?

Word originated in my year of birth is:

crowd-surfing, n.
Meaning: The action of lying flat while being passed over the heads of members of the audience at a rock concert, typically after jumping into the audience from the stage. Cf. stage-diving n. at stage.

Blog Creation

It is very interesting indeed how things happen. I set up my first blog ever when I was 15 I think. When I think about it now it seems such a long period of time since then.Ten round years. I used to blog about ‘hard teenage life’ (guess life is always hard for teenagers;) Boys, grades, who was going out with who at the time. Such important stuff! I carried that blog for 4 years till I had to delete it.

My next blog was set up 2 years ago. Carried on through my ‘stormy times’, completely forgotten since I found more amusing hobbies than blogging. Suddenly and accidentally I found my second blog still existing about two weeks ago. It was a very amusing experience, reading my own thoughts from years before and finding them still up to date.

This blog is going to be totally different. No sweet-sour emotional stuff. I am going to share my experience of young professional learning/expanding knowledge of Internet Era blessings.

For those who have never had blogging experience before I recommend the video below:

https://www.youtube.com/watch?v=jFLbdTUZdhQ

I recommend You Tube in general. It is like internet inside of Internet. If you do not know how to do sth or have never seen certain thing – type it in YT straight away . It is really impressive what people publish there. From erotic massage tutorial to 25 years old russian washing machine spinning program. Have a look if you do not believe me!

https://www.youtube.com/watch?v=3QvgRxdAZYE

Going back to my blog I decided it to keep it straight and simple. As usual. One main picture as a wallpaper and necessarities on side. I do not like too many widgets, decorations or other components that distract reader and myself. I have always felt like content is the main thing. If the content is good enough, there’s no need to make it more ‘attractive’. After all it is all about words, isn’t it?